The August sell-off autopsy: why interest rate swap volatility indices are key

By Anand Venkataraman, Head of Benchmark and Indices Product Management, Parameta Solutions
On August 5, institutional investors around the world woke up to their terminals flashing red. Global markets were haemorrhaging as fears of a possible US recession took hold. The turbulence, however, was short-lived. A week later markets had returned to relative normality. The intensity of the market reaction and recovery was a stark reminder of the speed and impact of volatility.
While institutional investors have a multitude of sophisticated analytics at their fingertips, identifying the root of volatility and deciding an appropriate response is crucial. In August, spiking equities indexes – such as the VIX, or the so-called ‘fear index’ – grabbed headlines and drew investor attention; however, one of the key triggers for the sell-off was participants’ perception of interest rates uncertainty.
Understanding markets’ true sentiment toward rates volatility is important not only for those trading fixed income or derivatives. During times of market stress, all participants need to be able to draw from data that allows them to see beyond the panic. Accessing the right information and viewing it alongside other datasets can contribute to more informed decision-making, breaking the herd mentality and mitigating some of the anxiety that contributed to the August furore.
Taking a pulse
When the narrative consuming global markets is of growing uncertainty around the shift to a lower-rates environment, cutting through the noise and gauging true sentiment is a significant strategic advantage. Institutional investors need to choose the right tools to stay ahead.
Interest rate swap volatility (IRSV) indices are an essential tool in uncovering the sentiment of interest rate traders who live and breathe rates, offering a unique window into anticipated future uncertainty. By representing implied volatility of swap rates, the indices can help investors assess swap rate volatility a month or a year in the future and therefore understand the likely trajectory of these participants beyond knee-jerk reactions to a market-moving event.
For some, IRSV indices played an important role in guiding their response to the August sell-off. To understand how, it is important to unpack how the situation unfolded. The scene was set at the end of July, as the Fed decided to hold rates and hinted at a September rate cut, which the market interpreted as a sure sign that rates finally start to come down. Less than 24 hours later, the BoJ took the seemingly momentous decision to hike rates – suggesting another hike is possible – and was rapidly followed by a slew of disappointing US economic data, led by jobless claims which came in significantly higher than expectations.
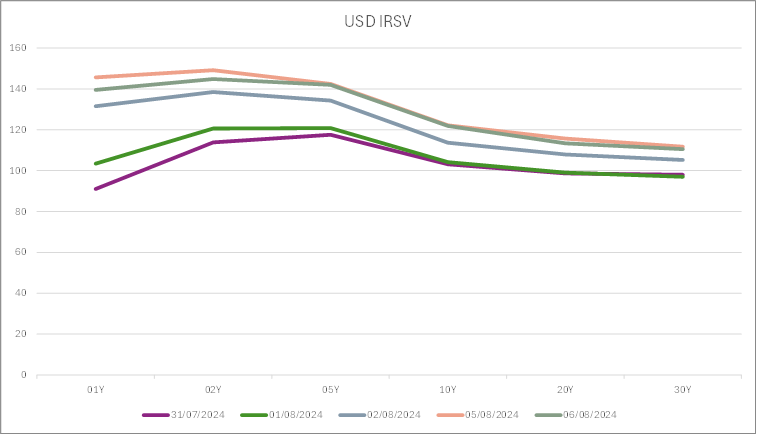
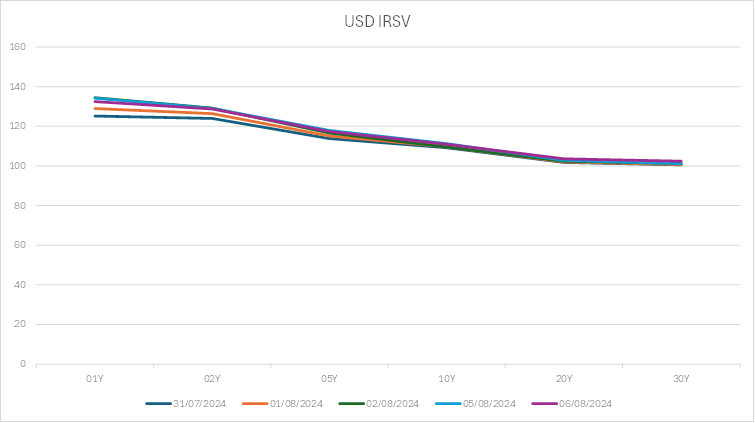
This series of surprising events in short succession triggered a chain reaction that threw markets into temporary chaos – from rapid unwinding of currency trades, to whipsawing bond yields fuelled by fresh rates uncertainty, and a rapid sell-off of major stock indices as investors fled to safety. Those looking at the IRSV indices would have seen a steep spike over the shorter one-month horizon, compared to a longer one-year horizon and increased uncertainty in the shorter swap tenors (usually referred to as the ‘top left’ of the volatility cube) compared to the longer tenors.
Similar IRSV indices behaviour has been demonstrated in previous instances. Take the collapse of SVB and the subsequent stress in the European banking sector as an example – on March 10, at the point of SVB’s collapse, the indices saw a dramatic spike in one-month implied volatility when compared with one-year implied volatility and reshaped the volatility term structure. The immediacy of the impact on the indices and the granularity available for various time horizons and rates tenors, allowed participants to see beyond the headlines to assess the real impact of the events and take decisive action in a challenging environment.
Prevention is better than cure
Data science and analytics have come a long way in a relatively brief period, allowing investors and risk managers to gauge market sentiment beyond short-term panic but also to avoid complacency. To stay ahead, investors need to deploy diverse and highly sophisticated tools that can help them gauge market uncertainty.
While the use of IRSV are essential, institutional investors may choose to include these as part of a broader data set guiding their decisions. Collectively identifying the appropriate sources of uncertainty driving market sentiment - in the case of the August sell-off, rates - and using suitable tools to make more informed decisions are essential for tactical investment choices.
One Month Implied Volatility
One year Implied Volatility
Found this useful?
Take a complimentary trial of the FOW Marketing Intelligence Platform – the comprehensive source of news and analysis across the buy- and sell- side.
Gain access to:
- A single source of in-depth news, insight and analysis across Asset Management, Securities Finance, Custody, Fund Services and Derivatives
- Our interactive database, optimized to enable you to summarise data and build graphs outlining market activity
- Exclusive whitepapers, supplements and industry analysis curated and published by Futures & Options World
- Breaking news, daily and weekly alerts on the markets most relevant to you